

 SCI Artisan Official
Segmented pie charts can show composition, proportions, or groups. Set up the sectors before adding text to reduce later adjustments.
Draw a segmented pie chart
Choose Pie chart in the basic shapes library and drag on the canvas. Click the ring band to select the whole chart. Its segmented-ring properties appear on the right.
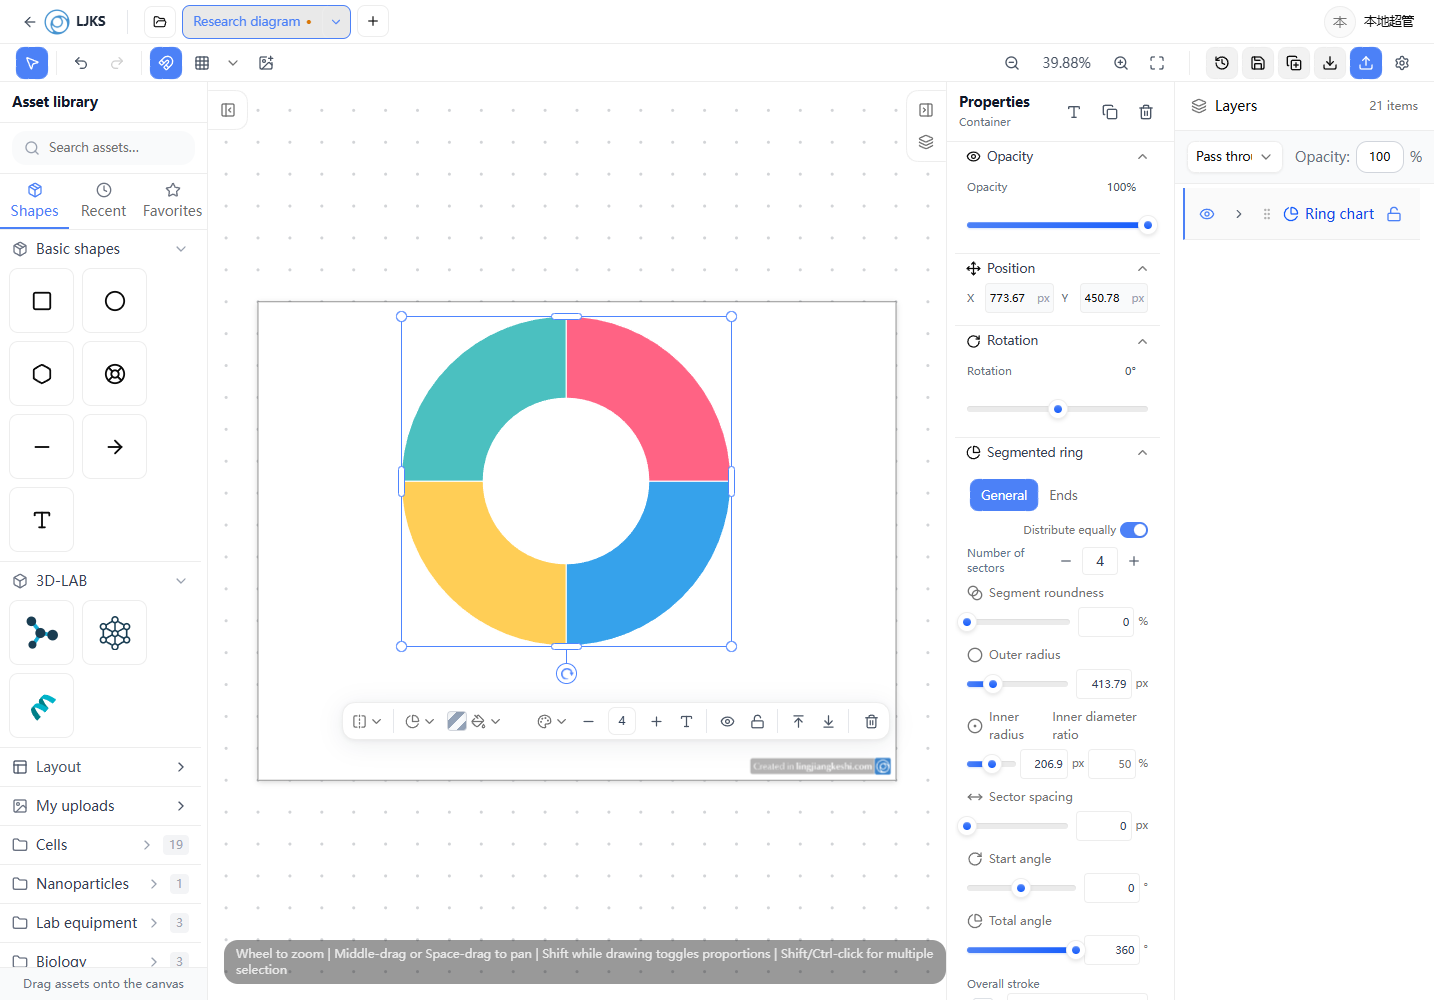 Whole-chart properties and sector list
Set sectors and proportions
Add or remove sectors using the floating toolbar or properties panel. With Equal sectors enabled, sectors use equal proportions. Turn it off before setting individual proportions in the sector list.
Adjust appearance
- Outer and inner radius: change the overall size and ring thickness.
- Sector gap: adjust the space between sectors.
- Start angle and total angle: change orientation and angular coverage.
- Roundness and ends: adjust edge shape within the permitted range.
- Fill and stroke: control colored regions and their boundaries separately.
Double-click a sector to change its individual style. Before editing, check whether the whole chart or a single sector is selected.
Add path text
Select the chart and choose Add path text in the floating toolbar or properties panel. The platform creates independent path-text elements for the current valid sectors.
- Double-click the text and enter your content.
- Set the font, size, and color.
- Adjust its position and orientation for the available arc length.
- Check that neighboring labels do not overlap.
Changing sector counts or proportions later does not automatically add, remove, or reposition existing path text. Check text placement again after changing the structure.
Check before export
Make sure proportions, labels, and legends agree. For narrow sectors, shorten labels or reduce their font size. Do not judge final clarity only from the editor’s current zoom level.
Save the project, then use Saving and exporting to choose an output format.